How to code JSXGraph axes, ticks and grids
By Murray Bourne, 13 Oct 2014
I've been creating graphs with JSXGraph for some time now, and I often get caught up with the problem of getting the axes to do what I want. Often you can't see the grid lines, so you have no idea of the scale of the graph, as can be seen in this screen shot.
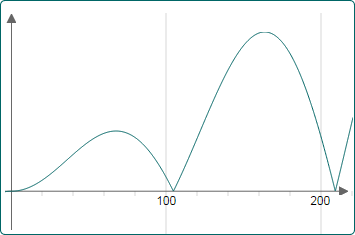
No y-axis scale indication - JSXGraph plot
Similarly, I found the business of creating grids (or are they ticks?) was quite troublesome.
So I set about trying to get it clear in my own mind. I wrote a summary of my discoveries here:
It's presented in several steps which increase in complexity. By the end, you'll see a graph that allows you to:
- See grid lines and labels all the time, no matter what zoom level is used
- See axes all the time (by "docking" them to the side if the graph is dragged - or zoomed - so the axes would go beyond view)
- Zoom in and out in one direction only (along the x- or y-direction)
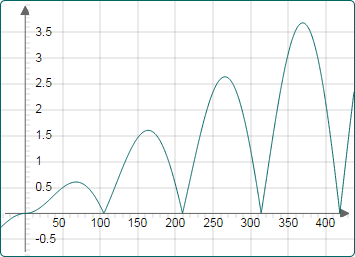
Improved grids on a JSXGraph graph
I hope those of you new to JSXGraph will find it useful.
See the 9 Comments below.
5 Jan 2015 at 12:28 am [Comment permalink]
Thank you and much needed examples. This will save hours, or perhaps more importntly, allow projects to move ahead.
Some of the plots seem to be demonstrting zoom, but the zoom pnel is missing. Is it suppoesed to do that?
5 Jan 2015 at 12:31 am [Comment permalink]
Sorry, I guess I have to read your post more closely.
7 Jan 2015 at 10:54 am [Comment permalink]
@John: Glad you found it useful. Yes, I use the keyboard-based zoom most of the time now (rather than the navigation panel), as it is a lot quicker and easier.
23 Apr 2015 at 8:18 pm [Comment permalink]
Hello,
I need grid cells, be square.
In this example:
https://www.intmath.com/cg3/jsxgraph-axes-ticks-grids.php
they are rectangles.
How do I solve this problem?
Thanks
24 Apr 2015 at 9:36 am [Comment permalink]
@Adrian: You need
keepaspectratio:truein the board definition. There's an example about half way down the other JSXGraph example page, here:https://www.intmath.com/cg3/jsxgraph-coding-summary.php
11 Nov 2016 at 9:17 pm [Comment permalink]
How can I make triangle vertices draggable?
Am I have to add $().draggable to it?
12 Nov 2016 at 8:17 am [Comment permalink]
@Damu: JSXGraph points are draggable by default.
To create a triangle with draggable vertices in JSXGraph, you could use this example Polygons but use just 3 points.
17 Apr 2017 at 7:11 pm [Comment permalink]
How can i use sub-script / super-script values as angle values?? like (x0,x1,..)
17 Apr 2017 at 7:51 pm [Comment permalink]
@ravi: This is how to do it:
var txt = board.create("text", [2,2,"(x_0, y_0)"]);