IntMath Newsletter: Bubble sort, symbols, study skills, stress
By Murray Bourne, 21 Jun 2019
21 Jun 2019
In this Newsletter:
1. New on IntMath: Bubble sort rainbow
2. Resources: Symbols, study skills
3. Math in the news: Number sense
4. Math movies: Stress and learning
5. Math puzzle: Pencils
6. Final thought: No environment, no economy
1. New on IntMath: Bubble sort rainbow
2. Resources
(a) What math symbol is that?
One of the beauties of mathematics is a downside for new learners. Mathematicians love to be precise and concise, so they make use of a vast range of symbols, which can make things very confusing for the novice.
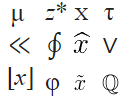 |
In the image at left, there are 12 math symbols. Can you name each one, and give an example of its use? |
Here are some places you can find out the meaning of all these symbols (and more), with examples of their use:
Basic Math Symbols (RapidTables)
List of mathematical symbols (Wikipedia)
Exhaustive List of Mathematical Symbols and Their Meaning (ScienceStruck)
Common Symbols in Mathematics: Maths Glossary (SkillsYouNeed)
You may also be interested in my discussion here:
Towards more meaningful math notation
(b) Study skills tips
 |
Many students are ineffective and inefficient when it comes to study time. It gets worse as the number of distractions — mostly from devices — gets worse. |
Here's a list of study tips I came across recently. We can't expect too many students to read and act on such a list (that's not realistic), but they could form a good starting point for a class activity.
25 Scientifically Proven Tips For More Effective Studying
Exercise: The title says the tips are "scientifically proven". Do you agree there's enough evidence in the article to conclude this?
3. Math in the news:
'Number sense' in humans and animals
|
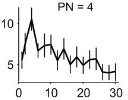
Researchers from the University of Tübingen were studying how an artificial neural network classified objects from images, and they noticed a curious and unexpected outcome — the network began to develop a 'number sense'. For example, while examining the image of 4 dots (top), the neural network had peak activity at the number 4 (bottom) |
According to the original paper, Number detectors spontaneously emerge in a deep neural network designed for visual object recognition:
Although our model was merely trained to classify natural images in a task that was unrelated to numerosity, its spontaneously emergent numerosity-tuned units allowed reliable categorization of the number of items in dot displays. These findings suggest that the spontaneous emergence of the number sense is based on mechanisms inherent to the visual system.
For an accessible summary of the research, see: 'Number sense' arises from the recognition of visible objects
4. Math Movies
It's summer holidays for many of you now and your stress levels are probably lower now than the last time you took a math test.
It's a good time to think about how to address your stress, before the next semester starts. Here are 2 videos covering the issue, each from a different point of view.
(a) The surprising link between stress and memory
(b) Why we choke under pressure and how to avoid it
5. Math puzzles
The puzzle in the last IntMath Newsletter asked about averages in a bowling game.
Correct answers with sufficient reasons were submitted by Rebecca, Michael, Tom, Gerard, Nicola (who rightly questioned one of the assumptions of the question), Eamon, and Deborah.
New math puzzle: pencils
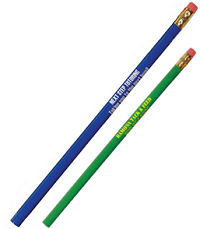
We have two cylindrical pencils where the ratio of the height to the diameter is the same for the first pencil as for the second. If the sum of their heights is 1, the sum of their surface areas is 8π and the sum of their volumes is 2π, find all possibilities for the dimensions of each pencil.
You can leave your response here.
Request: If you present your answer with a full explanation of how you obtained it, then others can follow it and learn something from it.
6. Final thought - economies and ecosystems
There is understandable concern that jobs (mining, manufacturing, energy) will disappear if nations actually get serious about mitigating climate change.
In We Can't Have A Thriving Economy Without Thriving Ecosystems, David Festa makes the point that destroying ecosystems destroys jobs, and more importantly, destroys food sources.
It seems to me we all need to make our lifestyles more sustainable. That means some jobs will disappear, but it's possible that many more — ones better for the planet and our enjoyment of our planet — will be created.
Are we willing to lose a bit, or do we all lose the lot eventually?
Until next time, enjoy whatever you learn.
See the 5 Comments below.



21 Jun 2019 at 10:55 pm [Comment permalink]
Note for 2.b
Dear Murray,
I have found this website very useful when advising studnets about effective and proven stundy skills techniques:
http://www.learningscientists.org/
For a start they only talk about 6 stategies which are managable.
I hope you find it useful too.
Best,
Eva
22 Jun 2019 at 4:06 am [Comment permalink]
@Eva: Thanks for the resource!
22 Jun 2019 at 6:24 am [Comment permalink]
I'm sorry, Dave. I'm afraid I can't do that.
Something messed up. :-(