IntMath Newsletter: Vector graphics, regression manga
By Murray Bourne, 19 Sep 2016
19 Sep 2016
In this Newsletter:
0. Notice any problems on IntMath?
1. Vector graphics
2. Review: Manga Guide to Regression Analysis
3. Math in the News: The Math Revolution
4. Math movie: Why the Metric System Matters
5. Math puzzles
6. Final thought: Math trauma
0. Notice any problems on IntMath?
|
|
IntMath now has over 2,000 pages (450 in the lessons area; 1100 in the blog, and 500 in the forum). It involves many scripts and over time, some things might not work as intended. |
Please let me know (on the feedback page) if you spot any problems, error messages or things that appear broken.
It's always appreciated!
1. Vector graphics
I've been playing a lot with vector graphics lately. They're a much better way to produce math graphs for the Web compared to fixed images, and they have interesting built-in mathematical capabilities.
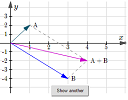
a. Using vector graphics to illustrate vector addition
 |
This simple applet demonstrates the concept of vector addition. Clicking the button produces a different example each time. |
The above applet uses SVG (scalable vector graphics) to produce the graphs. It's much easier than using graphics software (where you would have to produce hundreds of individual graph images).
Recently I've been converting all the old raster-based graphs on IntMath to much more attractive (and mathematically oriented) SVG images.
The basic idea is that instead of creating a fixed image using a graphics program (like Photoshop), you tell the computer what you want in your image via some code. There's a brief explanation of the required code on the above page, below the applet.
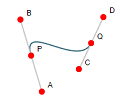
b. Vector art
c. Math of vector art with interactive cubic Bezier curve
The following page tells what's going on in a vector image.
2. Review: Manga Guide to Regression Analysis
|
The Manga Guide to Regression Analysis continues the tradition of presenting math through comics. Here's my review. |
3. Math in the News: The Math Revolution
In July last year, the 56th International Mathematical Olympiad was held in Chiang Mai, Thailand. Competing againsts the likes of China, Russia, Singapore and South Korea, for the first time in 21 years, the United States team won first place.
 |
This article from The Atlantic asks, "Why has the number of American teens who excel at advanced math surged?" |
The article outlines several things that may explain the improvement, including out-of-school experiences like the MathPath, AwesomeMath, MathIL math enrichment camps, and Math Circles, as well as participation in international math contests like Math Kangaroo.
What caught my eye was the authentic excitement that students experience in these camps and contests, especially when involved in collaborative problem solving activities.
4. Math movie: Why the Metric System Matters
In the US, Metric Week this year is 9-15 October 2016. It seems peculiar to me why there is such resistance against the metric system there.
|
This short animated video gives some background on the metric system and partly explains why only one country is holding out against adopting it. Video only: Why the metric system matters |
See the full original TED-Ed lesson here:
5. Math puzzles
The puzzle in the last IntMath Newsletter asked about the number of bus routes in a city.
There were only two attempts and unfortunately, neither of those solutions stated the correct number of possible routes. For those who would still like to have a go at it, here's a hint.
Hint: Let S1, S2, S3, ... S11 be bus stops on Route 1 (R1), and T be a bus stop not on R1. Because of the second condition, we can go from T to each of the 11 stops of R1. By the 3rd condition, each of the routes through T passes through one and only one of the stops on R1.

New math puzzle
 |
Any domino tile (except the double blank) can be considered as a fraction with value ≤ 1. For example, the tile in the middle of the image would be 2/5. What is the sum of the fractions on the tiles in a "double-six" set? |
You can leave your responses here.
6. Final thought: Math trauma
In an earlier Newsletter I mentioned Jo Boaler's controversial book Mathematical Mindsets. Despite the naysayers, I think the issue of "math trauma" is an important one that students and teachers need to address.
I like a lot of Annie Murphy Paul's ideas on her The Brilliant Blog. She wrote a piece last year, 'The Common Experience of "Math Trauma"'. In that article, she shared one of her own traumatic experiences where she was asked to solve a problem on the board in front of her class - and her family. Engaging students in class is a good thing, but not when it leaves them upset, and subsequently anti-math (or anti-science, or anti-learning).
Here's a quote from that article:
"A high level of intensity of negative emotion around mathematics is not uncommon. Mathematics, more than any other subject, has the power to crush students’ spirits, and many adults do not move on from mathematics experiences in school if they are negative. When students get the idea they cannot do math, they often maintain a negative relationship with mathematics throughout the rest of their lives.”
The first step for improving the situation is to recognize it exists. You may find the rest of the article illuminating.
Until next time, enjoy whatever you learn.
See the 5 Comments below.


19 Sep 2016 at 9:22 pm [Comment permalink]
Fascinating article about "maths trauma". One experience of mine never forgotten was at around the age of 6 years old in my UK primary school when we were taught about pounds, shillings and pence. I had no problem recognising the interesting curiosity that 16pence was the same as one shilling and fourpence, and that when adding pounds shillings and pence one either carried across 12 pence as one shilling or 20 shillings as one pound. But when I went up to the next grade we were introduced to the decimal system of units, tens and hundreds.I simply could not figure out why ten became one when carrying it across into the tens column and was sent out of the class until I could understand it. Ah, those were the days of teaching mathematics............And they hadn't improved when I went to grammar school some years later.
Maths is a language; it needs to be taught as such. One can only learn by making mistakes.
20 Sep 2016 at 1:34 am [Comment permalink]
Assuming that a "blank" ='s to 0, and that a "blank" is not a divisor, then the answer is 13.5.
Assuming that a "blank" ="s to 0, and that a "blank" divisor is thrown out as meaningless, then the answer is 57 + 65/72.
(in the former a tile with a 6 and a 4 would read as 4/6: in the latter it would be read as 6/4).
I hope this is right.
20 Sep 2016 at 2:59 pm [Comment permalink]
Hi Murray
Thanks again for your great work and the monthly letter.
I saw a few days ago for the first time how to multiply two complex numbers graphically, thus two 2-dimensional vectors. It took me awhile to realize why it works. Do you know the procedure?
regards
Rika
20 Sep 2016 at 3:49 pm [Comment permalink]
@Rika: It's an interesting topic. I hope I'll have time to write an article on the graphical explanation for multiplying complex numbers sometime soon!
14 May 2018 at 3:48 pm [Comment permalink]
@Rika: I finally had a chance to create some applets that display multiplication and division of complex numbers. You'll find them on this page: Graphical explanation for multiplying and dividing complex numbers.
I hope it makes sense!