IntMath Newsletter: Witch Agnesi, Hypertools, Etalumis
By Murray Bourne, 28 Nov 2019
28 Nov 2019
In this Newsletter:
1. New on IntMath: Witch of Agnesi
2. Resources: Hypertools, tech
3. Math in the news: Light, Etalumis
4. Math movies: Mod, culture
5. Math puzzle: Mean, mode
6. Final thought: 20
1. New on IntMath: Witch of Agnesi
I've started a series of articles on historical math curves.
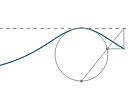 |
The first one is the "Witch of Agnesi", which is not a witch at all, and was included in a math handbook written by a rarity of the 18th century: a female mathematics academic. See: Witch of Agnesi |
The page has some background to the curve and some animations explaining how it is constructed. There's even a connection between this curve and calculus.
2. Resources
(a) HyperTools transforms complex data into visualizable shapes
Data will be the most valuable commodity in the 21st century, and those able to make sense of it will do well. This tool could help.
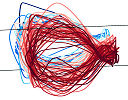 |
Dartmouth College has released the open-source package HyperTools, which can transform data into visualizable shapes or animations for data comparisons and testing theories. See: HyperTools transforms complex data into visualizable shapes |
(b) Teaching Math With Technology: 8 Virtual Resources
Most of you will know I'm a fan of technological approaches to teaching and learning of mathematics.
 |
Here are some resources (some free, some paid) that can help with this. |
3. Math in the news
(a) Mathematics at the speed of light
Image processing is at the core of augmented reality, autonomous driving and facial recognition. But because it's currently achieved using electronic circuits, it's too slow.
 |
A new optical computing and imaging technique operates at the speed of light and the mathematical operation itself consumes no energy. |
(b) Etalumis 'reverses' simulations
Simulations are developed to try to understand and predict the future of such things as climate change, disease transmission and cosmic events. But how do we interpret and make best use of new data?
A new system, called Etalumis ("simulate" spelled backwards) developed by a group of scientists from the University of Oxford and others, makes use of Bayes' Theorem (which is a way to calculate probabilities based on probabilities for events that have already occurred) to solve such problems.
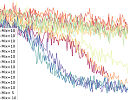 |
Etalumis uses Bayes inference to improve existing simulators via machine learning. |
4. Math Movies -
(a) Modular Arithmetic Visually Explained
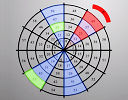 |
This video (by Brilliant) explains modular arithmetic. It moves fairly quickly, but that's the beauty of videos - you can pause and go over parts. |
(b) Charting Culture
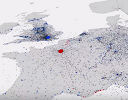 |
This is an interesting way to visualize the spread of culture throughout history. The animation distils hundreds of years of culture into just five minutes. See: Charting Culture |
The comments rightly point out some of the cultural biases in the video, but it probably can't be helped when compressing such a highly complex data set into just 5 minutes.
5. Math puzzles
Clarification: The puzzle in the September IntMath Newsletter asked about the probability involved in a given octagon. There were conflicting answers given, and I provided a solution. However, it turned out my attempt had a problem, and Tomas' answer was correct. You can see the discussion here: Octagon discussion
The puzzle in the last (October) IntMath Newsletter asked about "square ages".
There were two parts to the puzzle, and Thomas was the only one who got both parts correct. (Special mention to Don who got the first part, and the range of years correct for the second part.)
New math puzzle: Mean or median?
The table below shows the daily earnings for two workers for 5 days and the mean and the median salary.
| Person A | Person B | |
|---|---|---|
| Day 1 | $100 | $72 |
| Day 2 | $87 | $97 |
| Day 3 | $90 | $70 |
| Day 4 | $10 | $71 |
| Day 5 | $91 | $100 |
| Mean | $75.60 | $82 |
| Median | $90 | $72 |
(a) Which statistic, the mean or the median, would be best to describe the typical daily salary for the 5 days for Person A? How about for person B?
You can leave your responses here.
6. Final thought - 2020 and 20 years
Jean-Francois Rischard, ex-World Bank vice president wrote the book High Noon: 20 Global Problems, 20 Years To Solve Them in 2003. Sadly, the scorecard for his 20 Problems is rather abysmal as we approach the 20th year of the century.
I wrote a summary review of the book in 2008. I concluded by saying:
Mathematics is involved in the solutions for all these problems. So instead of doing algebra with no purpose other than to pass an examination, let's put our mathematical efforts into coming up with ways to solve (at least some of) these problems.
Governments should be placing many of the 20 Global Problems in the center of their policy frameworks, but they're not, and too many governments are actively doing the opposite.
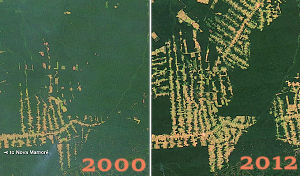
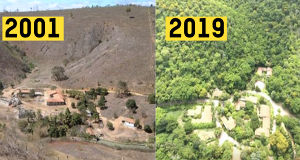
As a counterpoint to the destruction of the Amazon, here's what one Brazilian photographer achieved in 18 years, something that should be happening worldwide:
Please be careful who you vote for...
Until next time, enjoy whatever you learn.
See the 9 Comments below.

28 Nov 2019 at 9:55 pm [Comment permalink]
I have begun to curse the those nerds/mathematicians who give our politicians tools they abuse for facial recognition and surveillance (e.g yet more computing power and processing speed). There is such a thing as social responsibility and ethics in science;as an older scientist it is pity that the great majority of scientists seem willing to sell whatever soul they once possessed for the next grant to satisfy their curiosity and publications list.
Thanks again for a very helpful blog.
Bob
28 Nov 2019 at 10:05 pm [Comment permalink]
It depends on whom you are providing the statistics for; (1) the taxman, (2) the Family Court Judge, or (3) the neighbour's wife whom you want to impress. For Person A, (1) and (2) are best given the mean and (3) the median. Conversely for person B.
29 Nov 2019 at 1:46 am [Comment permalink]
The median would be the more suitable average to use due to the presence of outliers
29 Nov 2019 at 3:34 am [Comment permalink]
Hello Mr. Murray.
Regarding the solution for the puzzle titled 'Mean of Median':
For person A I would use median, whereas for person B I would use mean.
Main reason for using median for person A is that the data for person A has an outlier ($10) which makes mean unsuitable for what we are measuring.
Best regards,
Danesh Forouhari
29 Nov 2019 at 4:17 am [Comment permalink]
I do not think there is a mathematical answer to this question. But as far as I am concerned I feel the Median is a better representation of the Typical day in both cases.
29 Nov 2019 at 7:26 am [Comment permalink]
In looking at a visual plot of each data set, neither mean nor mode satisfactorily reveal "a typical" anything.
Outliers and distant clusters of data points render both measures
as illusions.
Nor does the old Box and Whiskers blot do much better.
Perhaps you know of an approach that groups the points into
clusters.
Then give a mean or median for each cluster.
Of course will need to devise an algorithm for the notion
of "cluster" and "outlier".
Probably already worked out by engineers doing optical processing.
ct
29 Nov 2019 at 5:58 pm [Comment permalink]
I think for worker A it would be best described by median as there is a single value too far from the other values. That might count as an exception, thus, median value approaches more the total values (except one of the values).
For worker B it is better described by mean although even median would not be that terrible.
1 Dec 2019 at 10:15 am [Comment permalink]
Mean for both persons
17 Dec 2019 at 8:18 pm [Comment permalink]
Mean seems like the appropriate answer.