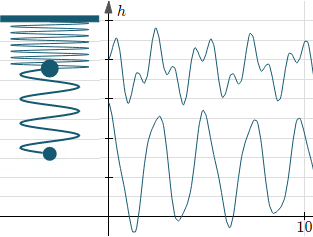
Double springs interactive graph
By Murray Bourne, 25 Oct 2017
I recently updated the double springs graphs interactive applet (you'll see it about 1/3 way down the Composite Trigonometric Curves page, here):
Double Springs Interactive Graph
The applet demonstrates one example of composite trigonometric curves. That is, the result we get from adding together different periodic (and non-periodic) signals.
Here's a screen shot:
Applications
Very few signals in electronics are pure sine curves. Instead, they are a combination of DC (direct current) and AC (alternating current) signals and the job of any receiver (like your phone, TV or radio) is to split apart those combined signals into something useful.
Apart from electronics, we come across composite trigonometric graphs wherever waves are combined (like ocean waves with smaller ripples caused by the wind, or eathquakes).
Background to the applet
The composite trigo applet was one of the most complex ones I've ever written. There are many variables involved, and I needed to rewrite parts of my SVG script to allow for drag events on mobile devices. (I actually developed it some years ago for Flash, but have revised it a few times since since Flash doesn't run on mobile devices.)
The applet uses numerical integration to calculate the mass positions and spring extension amounts. The method used is Runge-Kutta (RK4). The basic idea with Runge-Kutta 4 is to solve a differential equation by starting with a given initial value and then following a path using appropriate slopes, thus tracing out the solution curve. (This is an extension of the thinking behind Newton's Method, which we use to find roots of equations.)
In the case of the double springs applet, it is a system of differential equations (the motion of each spring affects the motion of the other one) and so each step needs to allow for the different forces and velocities that are going on. So for each step, the Runge-Kutta function accepts the current 2 velocities of the 2 masses, and outputs the next 2 velocities for the subsequent step.
Other math used when developing the applet included:
- Trigonometric graphs (of course)
- Varying amplitude based on the stretch or compression of the spring
- Time
- Transformation geometry (translation and scaling of springs and masses)
- Matrices (the position of the masses and the springs are internally tracked via some matrices)
- Scalable vector graphics (images that are produced by telling the browser to draw objects via a script)
- Spring theory (mass, spring constants, extension, etc)
Be the first to comment below.

